 2023-04-04 16:45:37
In the Asian market, the gold price has been supported around US$1,980.00 after a gradual correction from above US$1,990.00. Gold prices were supported by rising chances that the Federal Reserve will maintain a steady monetary policy. Gold prices have found support despite a rebound in the U.S. dollar index (DXY).
The US dollar index found support around 102.00 and rebounded somewhat, however, in the absence of supportive indicators, the upside seems to be limited. The U.S. ISM manufacturing purchasing managers' index was weak, weakening expectations of Fed Chairman Powell raising interest rates one more time in a row. The U.S. Manufacturing Purchasing Managers Index has been below 50.0 for five consecutive months, prompting the market to begin to expect the Fed to adopt a stable monetary policy to protect the U.S. economy from recession.
Manufacturing data from the United States, the euro zone, the United Kingdom and Japan showed that activity in the world's major economies remained in contraction in March. This, coupled with weaker-than-expected Chinese manufacturing data, has heightened concerns that the global economy will weaken in the coming months.
Safe-haven demand for gold was revived after a string of weak manufacturing data from the world's major economies pointed to a possible recession for the rest of the year. The weaker-than-expected U.S. data also raised doubts about how much room the Fed has to continue raising interest rates, keeping the dollar in check.
According to the CME Group FedWatch tool, the probability of the Fed keeping interest rates unchanged has soared to more than 56%.
At the same time, the S&P 500 index futures in the Asian market fell slightly, and there were signs of long liquidation after large fluctuations, showing a little caution amid the overall optimistic market sentiment.
Prior to this, the price of gold had risen strongly in March, as the collapse of several U.S. banks exacerbated concerns about economic turmoil, and gold once broke through the $2,000 mark. While regulatory intervention has eased fears of a banking collapse, gold has remained elevated in recent weeks.
Looking ahead, the US ADP employment change (March) will be in focus. The data is expected to be 205,000, lower than the previous value of 242,000. Investors may get more clues about the labor market from the U.S. non-farm payrolls data due to be released this Friday.
In this trading day, we need to pay attention to the monthly rate of factory orders in the United States in February and the data on JOLTs job vacancies in the United States in February. In addition, you need to pay attention to news related to the geopolitical situation.
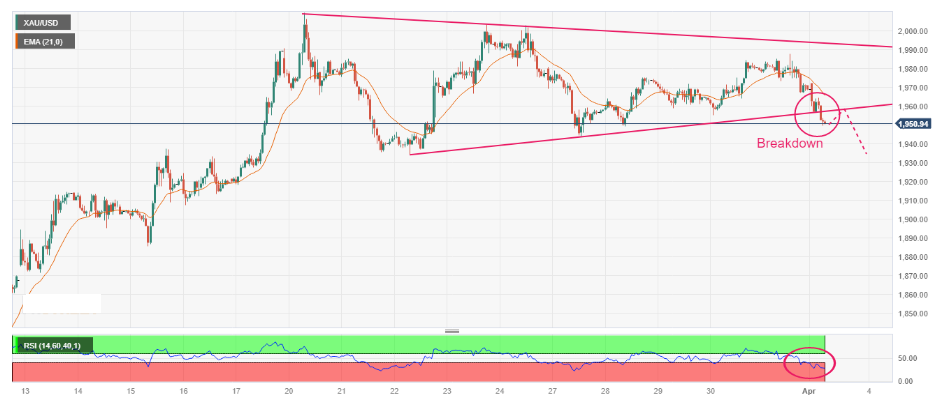
Spot Gold Technical Analysis
The hourly chart shows that the price of gold rebounded sharply after falsely falling below the symmetrical triangle pattern.
This points to responsive bulls at lower levels, suggesting that the downside is limited.
The uptrend trendline of the symmetrical triangle pattern in gold prices is from the March 22 low of $1,934.34, while the downtrend trendline is from the March 20 high of $2,009.88.
The price of gold is approaching a trend line that maintains an upward bias, and price fluctuations near here are worthy of attention.
The bulls are now aiming for a sustained break above the downtrend line resistance at $1,990.
Once the breakthrough of this pattern is confirmed, the gold/dollar may resume its upward trend, focusing on the $2,000 mark.
The next significant resistance levels are the yearly high at $2,010 and the psychological $2,050 level.
Meanwhile, the relative strength indicator (14) has retreated back into the 40.00-60.00 range, indicating that the upward momentum in gold prices has run out.
The 20-period EMA near $1,980.00 is forming support.
Short-term support lies at the rising trend line at $1,968, below which the bears could regain full control.
If it falls further, gold will challenge Monday's low of $1,950.
The last line of defense for the bulls is strong support at $1,935, which is where the bullish 21-day EMA lies.
Spot Gold one hour chart
JRFX shares news information and professional technical analysis on foreign exchange, spot gold or crude oil every trading day. Follow us so as not to miss the market focus of the day and grasp the trading market in time.
JRFX reminds you: the market is risky, and investment needs to be cautious. This article does not constitute personal investment advice. Please choose corresponding investment products according to your own financial and risk tolerance, and do a good job in corresponding risk control.
About JRFX
· 12 years of financial market experience, the choice of more than 4 million customers, one of the most respected foreign exchange brokers in the world
· Provide 50+ trading products, including foreign exchange, spot gold, crude oil, stocks, indices, cryptocurrencies, etc.
· Three trading accounts to meet the investment needs of different customers
· Zero commission, low spread, leverage up to 1:1000
· You can open an account with a minimum deposit of 100 US dollars only

