2021-05-07 17:00:36
01
What is Bollinger Bands?
The Bollinger Bands is a technical analysis tool. It’s a statistical chart characterizing the prices and volatility over time. It is defined by trendlines plotted two standard deviation away from a simply moving average (SMA) of a security’s price, which can be adjusted by user preference.
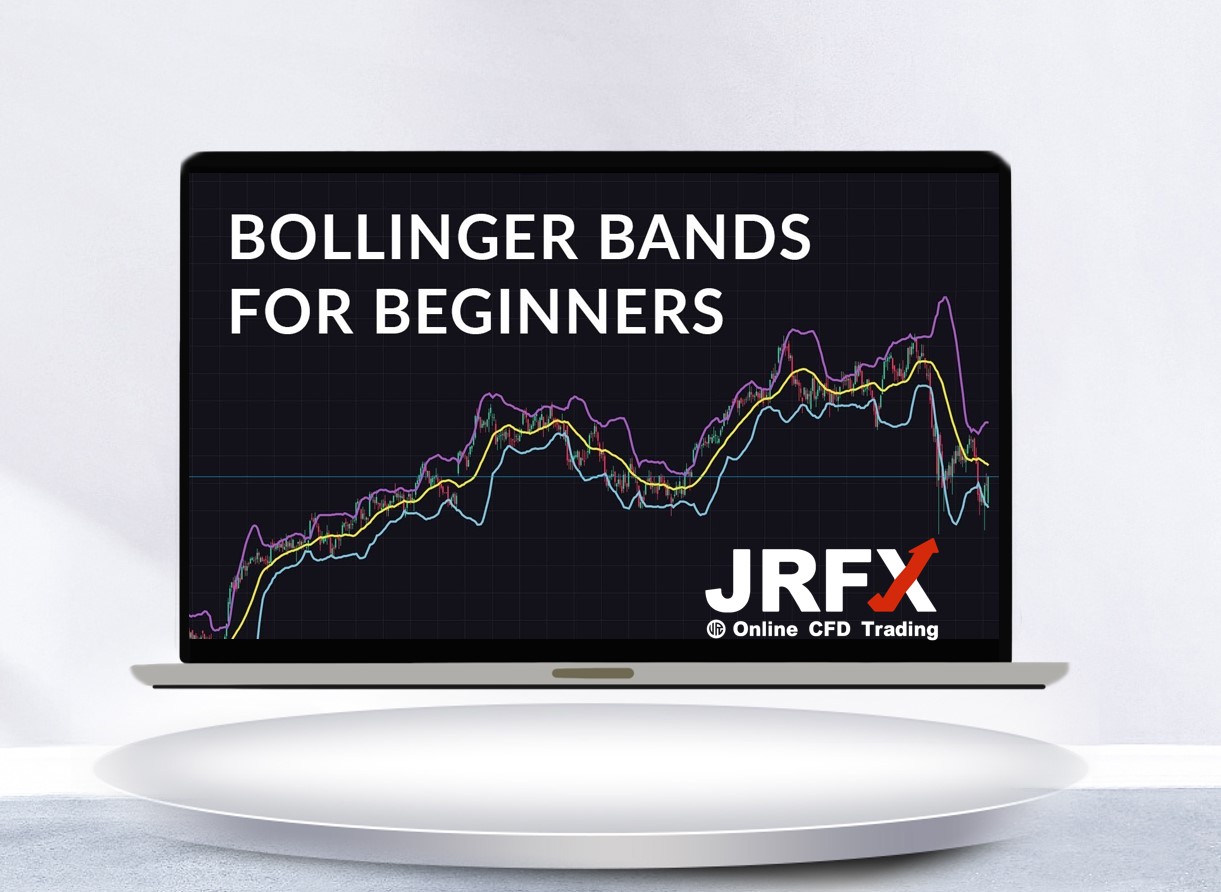
The Bollinger Bands was developed and copyrighted by a famous technical trader, John Bollinger in 1980s. Three lines compose Bollinger Bands:
· A simple moving average (SMA) line;
· An upper band (upper BB);
· and a lower band (Lower BB).
02
How to Calculate The Bollinger Bands?
Here is the formula of the Bollinger Bands:
Upper BB=MA(TP,n)+m?σ[TP,n]
Lower BB=MA(TP,n)?m?σ[TP,n]
where:
TP (typical price)=(High+Low+Close)÷3
n=Number of days in smoothing period (typically 20)
m=Number of standard deviations (typically 2)
σ[TP,n]=Standard Deviation over last n periods of TP
Moreover, there are three indicators based on Bollinger Bands:
· BB Impulse measures price change as a function of the bands;
· percent bandwidth (%bb) normalizes the width of the bands over time;
%b = (last price? lower BB) / (upper BB – lower BB)
· bandwidth delta quantifies the changing width of the bands.
Bandwidth = (upper BB – lower BB) / MA
03
What can we know from Bollinger Bands?
The Bollinger Bands is a highly popular technique. It can be used for stocks, options, gold trading, and so on. The usage varies widely among traders. Some traders buy when price touches the lower BB and exit when price touches the MA in the center of the bands. While, others buy when price breaks above the upper BB or sell when price falls below the lower BB.
A period of low volatility is indicated when the bands lie close together and vice versa. It’s also very important to use the Bollinger Bands with other indicators to predict the price.
Risk Warning: The above content is for reference only, and does not represent JRFX’s position. JRFX does not assume any form of loss caused by any trading carried out in accordance with this article. Please consult your financial planner for your investment portfolios and manage your own risk.
JRFX is an online CFD broker providing more than 50 products for Forex, metals and commodities. Open a trading account within a minute. Deposit 100USD and download our MT4 trading platform now! We have unprecedented promotion program!

|

|

|

|

Views: 1648

Likes: 0